The level of sophistication of Sudoku players varies hugely. I first discussed the process and the methodologies used to govern the interactions in a paper Spatial Modelling Techniques in Microsoft Excel. This paper considered the beginner level interactions with the puzzle.
The jump between the detail needed for beginners and that intermediate users is a major one. The design route we choose to take has significance both for the influence the player has both on the route he takes to solve the puzzle and the level to detail he has to contribute. The overall approach remains to demonstrate
- the step wise route that any individual used to solve the puzzle, and
- verify by analysis that those steps were valid.
as outlined in Sudoku: Options for layout and analysis in a Spreadsheet.
The decisions on how to automate and the level of sophistication of that automation process derive from experience - not always happy experience.
A Manual Approach
A curiosity about Sudoku puzzles is that essentially the same analytical process can nearly always be considered from two or more opposing perspectives. This is like viewing a mountain from its base or from its summit or from another nearby mountain. For example one can examine a row of cells and for each cell ask the question is there any single cell for which only one Identity is permissible because all others have been eliminated for that cell. Alternatively, you can consider the Identity group and ask the question is there any single Identity where only one cell within the row is permissible. Of course, it is necessary to ask the latter question in respect of each column and each sub-grid. It is this latter approach which generated my first detailed analysis of the Sudoku puzzle grid.
The spreadsheet layout is shown below. It demonstrates a case the player identified a solution for Id 2 in one cell; in this case Row 6 Column 9 (R6C9). However to complete the task, the user/player is required to consider and, if necessary, enter a value into each of the cells with a deep emerald green background.
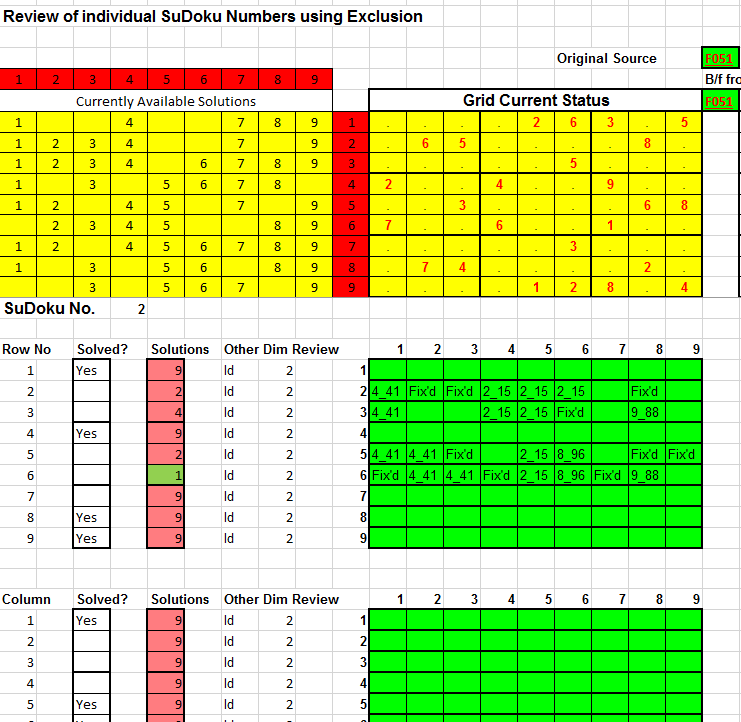
He is invited to review each Id (9) from each dimension perspective (3) and in respective each position in the Sudoku puzzle (81) - potentially there are 9 x 3 x 81 = 2,187 cells to complete.
Unfortunately, functional though this approach is, it does not deliver a verifiable step in the solution to the Sudoku puzzle. In the context of the spreadsheet model as compiled at that time, a further step was required. This is demonstrated below.

As the heading within the diagram implies, Sub-grid exclusion eliminates those cells where Id 2 already exists within the sub-grid. Whereas Columnar exclusion eliminates those single cells within the row where the Id 2 is already fixed for the column. The final row in this diagram states that only one position is permissible for Id 2 and, of course, that position is R6C9.
At this point, I confess, my patience gave way and I begin to wonder whether my readers will even have got this far.
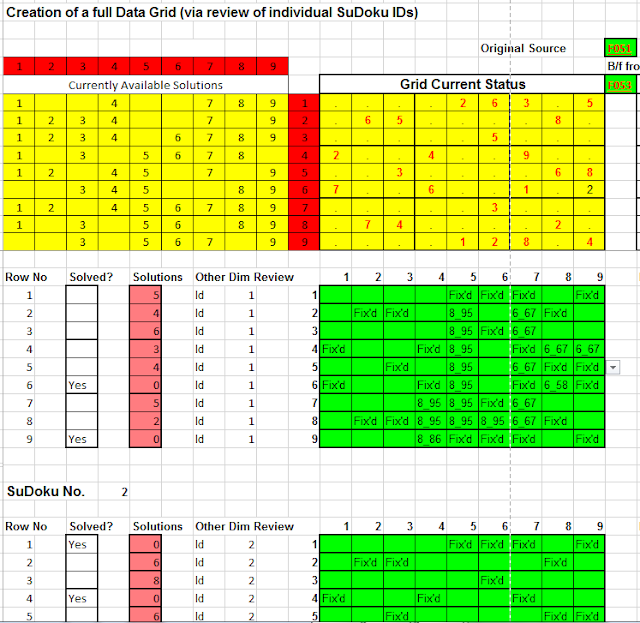
Finally, this analysis delivers a usable result. Instead of the 9 x 9 grid shown as "Grid Current Status" in the picture above, we have a 9 x 9 x 9 grid as shown below.

It shows all the essential detail about the state of the puzzle. Curiously, it does not answer the question proposed at the beginning of this blog. If it had the four Id's circled in red would have been presented as the solutions to their respective cells and presented with a green background.
While this detailed grid is a useful result, it still involves a substantial amount of work. Since the only user was likely to be me I set about automating the process still further.
Unfortunately, functional though this approach is, it does not deliver a verifiable step in the solution to the Sudoku puzzle. In the context of the spreadsheet model as compiled at that time, a further step was required. This is demonstrated below.

As the heading within the diagram implies, Sub-grid exclusion eliminates those cells where Id 2 already exists within the sub-grid. Whereas Columnar exclusion eliminates those single cells within the row where the Id 2 is already fixed for the column. The final row in this diagram states that only one position is permissible for Id 2 and, of course, that position is R6C9.
At this point, I confess, my patience gave way and I begin to wonder whether my readers will even have got this far.
Raw data and its potential uses
I was guilty of two failures. The review process described did not deliver a usable result for Sudoku player and also the player had to repeat essentially the same process for each of the three dimensions.
The revised process shown below eliminates the vertical and sub-grid dimensions. The horizontal dimension is much easier to follow in the user's imagination. This also excludes all cells where the result is known. These cells are marked automatically as 'Fix'd'. In addition if the Id for a row is known, the whole row is excluded from the analysis. The user is invited to review each Id in turn and manually exclude all cells where the presence of the Id in either the vertical or sub-grid dimension excludes its availability.


It shows all the essential detail about the state of the puzzle. Curiously, it does not answer the question proposed at the beginning of this blog. If it had the four Id's circled in red would have been presented as the solutions to their respective cells and presented with a green background.
While this detailed grid is a useful result, it still involves a substantial amount of work. Since the only user was likely to be me I set about automating the process still further.
Full automation
The automatic process are described in the blog Sudoku: Options for layout and analysis in a Spreadsheet. When the process is applied to to this Sudoku puzzle we get an output in the form shown below.

Careful examination shows the two outputs to be almost identical. The only change that I can see is almost certain to be a user error perpetrated by me.
Viewing a puzzle in Excel
These Sudoku puzzles are worked in within an excel workbook. This particular example may be downloaded at Observer Sudoku 20190525.
No comments:
Post a Comment