Sunday 26 May 2019

Sudoku: Options for layout and analysis in a Spreadsheet

To state the bleedin' obvious, a spreadsheet is a a two dimensional array of addressed cells. When working with an environment that has 3 or more factors that require analysis its presentation in terms of layout and organisation are of crucial importance.

A Sudoku is unusual in that it presents 3 dimensional factors (row, columns and sub-grids) in a 2 dimensional surface. A further confusion is that Sudoku uses that values 1 - 9, but these are not numbers and you cannot employ them in simple arithmetic. A pervasive view is that spreadsheets are exclusively for arithmetic purposes (like monetary accounting). I have always railed against that view and here I consider that options for modelling the solution to a Sudoku puzzle in a spreadsheet environment.

The Sudoku model and its Purpose

For many, the only purpose of an automated (or semi-automated) approach is to find a solution quickly. But you can do that by instinct and guesswork far more quickly than building a spreadsheet model. I thought that my model should demonstrate

  • the step wise route that any individual used to solve the puzzle, and
  • verify by analysis that those steps were valid.
There has been a long running debate among spreadsheet users and constructors about how much of the sheet should be visible when in every day use. This discussion is concerned with the integrity of spreadsheets in a commercial or administrative environment. Sudoku is a game and everything should be visible. My one concession to security is that I protect the individual worksheets in the process to prevent accidental changes to model verification elements, but they can easily be unprotected. There are no passwords.

How much detail?

This really depends on the sophistication of the analytical methods that any individual intends to employ.  Since it does not take long for enthusiastic players to get moderately sophisticated, I chose to include sufficient detail within the model to handle that. 

The puzzle for solution is normally presented as a 9 x 9 grid. For example


Most experts on Sudoku present the detail of a puzzle in the format below. There various forms of the method of presentation but they all have the same fundamental format of a large 3 x 3 grid each containing a medium 3 x 3 (the basic Sudoku cells) and each cell contains a 3 x 3 grid of the potential Identities. For presentation purposes, solutions are presented as large Identities that overwrite the lowest level of potential Id's.


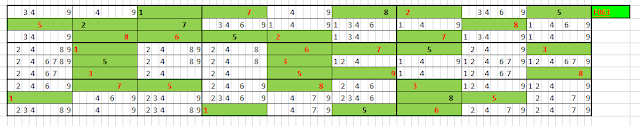
In theory, I could mimic this in Excel, but it was clear that the verification analysis would become very difficult and muddled. The choice of presenting the available Sudoku Id's for each cell in the seemed both convenient for presentation and for the analytical verification that would be required.

Even so a presentation that potentially contained all the detail of the puzzle, was likely to be difficult to understand at first glance (see below). A visual key to the Sudoku cells would be a huge advantage.


I would to make use of the presentational aspects of Excel that were inherent within a standard package. This suggested that an approach as shown below would be both functional and quickly understood.


The fist level of detail need to generate the presentation is discussed at A Game of Control and Error Management

Saturday 25 May 2019

Sudoku:A Game of Control and Error Management


The game of Sudoku and the methodologies for its solution have been  analysed by widely academics and other experts (for example The New Sudoku Players' Forum). The purpose of this article is to consider how we can demonstrate the relationship between the elements of the Sudoku once a particular Identity has gained control of an individual cell.

The modelling environment for this discussion is an Excel spreadsheet. An incidental consideration is the notion that spreadsheets have a wider modelling capacity than number crunching or simple database management.

Introduction - Names and Lists

The puzzled is built in a 9 x 9 grid of cells, but, from the perspective of a spreadsheet analyst, this is a very difficult structure to handle. We like simple lists. Also all Sudoku experts use a row/column nomenclature to describe their methodologies and solutions.

Conventional cell names for a Sudoku puzzle.


Our list is in the form of single column starting with the names of all the cells in row one and proceeding through each row. This gives a complete list of each of the 81 named cell.


Next we create a table, associated with the list of named controlling cells, of all the cells related to the controlling cells.


The cells which are logically associated with each 'master' cell. 
For example, if cell Id 42 contains the result 2 then it follows, by the rules of Sudoku, that a list of 20 further cells may NOT contain the result 2. These are:


  • In row 4 - cells 41, 43, 44, 45, 46, 47, 48 and 49
  • In column 2 - cells 12, 22, 32, 52, 62, 72. 82 and 92
  • and in the 4th sub-grid - cells 41, 51, 43 and 53


This analysis is repeated for each of the controlling cells within the list of 81 named list. The final table comprises 81 rows and 20 columns (excluding the name column).

Now we know the relationships between controlling cells and others in the Sudoku table, but the analysis depends both on whether the controlling cell contains a result AND the Sudoku identity of the result. In effect each Sudoku identity must be analyzed and computed separately.

The Analytical Process


The process for evaluating whether an individual Sudoku Id is still available as a possible solution to a cell is long winded. Each cell containing a result has been evaluated for its impact on its related cells (see above). The evaluation is now reversed. Each cell that is not a result cell is evaluated for whether a result cell eliminates the availability of that specific Sudoku Id. Inevitably, each Sudoku Id must be evaluated separately. See the table below. Where the summary table (the right hand column) is greater than zero, Sudoku identity 3 is not available to that cell.


In practice we start with a table of results that looks like this one immediately below. The row at the top refers to the individual Sudoku identities.


And end with a table of deletions that looks like this.


This is then combined with the original Sudoku puzzle to look like this,

This columnar presentation then has to be converted back to the standard looking Sudoku puzzle and will look as shown below.

My personal convention is to show result cells with a green background, the values of the original puzzle in red script, those that are user calculated in black script and the unsolved cells with a white background.